 IQ Finance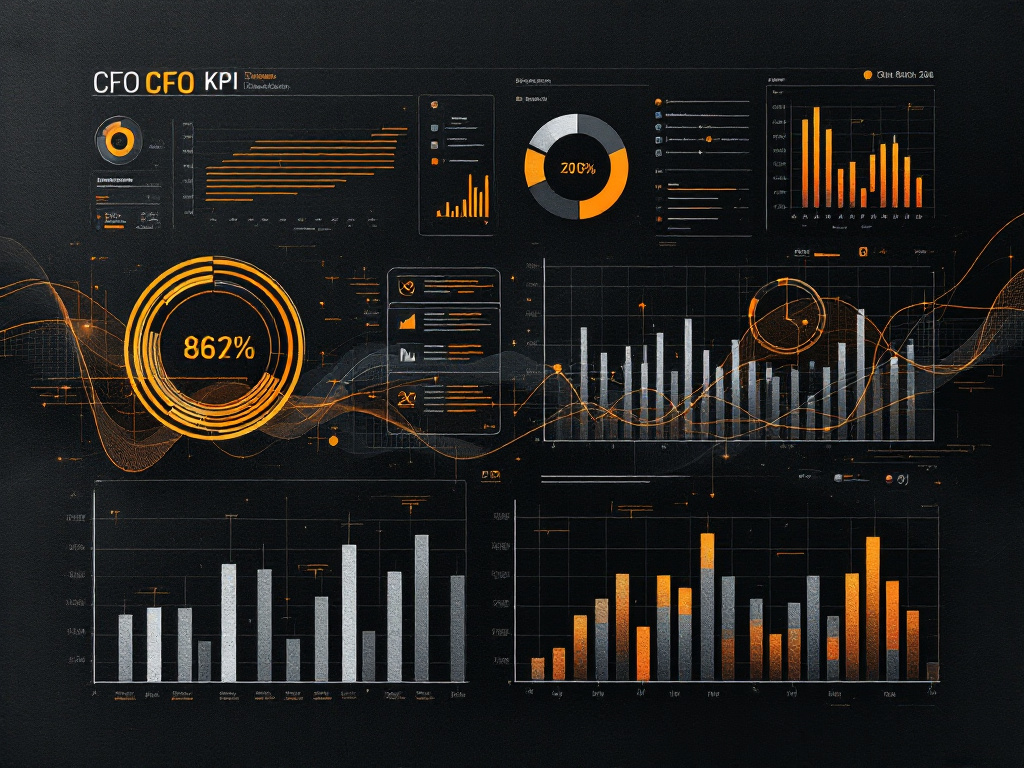
Your ability to swiftly gather and interpret financial data is more critical than ever. You need CFO KPI dashboard examples that provide instant insights into cash flow, profitability, and operational trends, so you can respond quickly to board-level questions on margin or shifts in strategic priorities. A well-designed dashboard does more than just organize numbers. It helps you focus on high-impact interventions, identify problem areas, and get solutions in motion before performance dips become systemic.
Below, you will find six examples of high-impact CFO KPI dashboards tailored to distinct industries and organizational structures. Each highlights key metrics, recommended refresh cadences, and effectiveness factors, so you can decide which approach best fits your strategic finance intelligence goals.
- SaaS CFO KPI dashboard
- Manufacturing CFO KPI dashboard
- Services CFO KPI dashboard
- Healthcare CFO KPI dashboard
- Financial services CFO KPI dashboard
- Multi-entity enterprise CFO KPI dashboard
SaaS CFO KPI dashboard
You likely face pressure to refine subscription revenue strategies and sustain robust renewal rates if you are operating in the highly competitive SaaS space. A specialized KPI dashboard can bring clarity to your recurring revenue model and usage-based pricing outcomes.
Target persona
This dashboard is designed for SaaS CFOs aiming to monitor monthly recurring revenue (MRR), churn, customer lifetime value (LTV), and acquisition costs.
KPIs included
Using a SaaS-focused CFO KPI dashboard typically means highlighting:
• Monthly Recurring Revenue (MRR)
• Customer Acquisition Cost (CAC) vs LTV
• Churn Rate
• Expansion Revenue from Upsells or Cross-Sells
• Cash Burn Rate
Many of these metrics serve as quantifiable high-level measures of financial performance (insightsoftware). By analyzing revenue expansion, you can see if your business model scales efficiently and if your sales efforts align with profitability goals.
Refresh cadence
Most SaaS CFOs prefer weekly or biweekly refreshes to catch churn spikes quickly or address underperforming campaigns that could erode MRR. The more data streaming you integrate, the better your capacity for near real-time financial analysis.
What makes it effective
Recurring revenue data, combined with churn analytics, is what drives your strategic foresight. When you keep close tabs on subscriber lifecycles, you can isolate root causes of customer attrition, introduce new pricing offers, and forecast potential revenue swings with confidence.
Manufacturing CFO KPI dashboard
Manufacturing CFOs often need clarity around operational costs, supply chain efficiencies, and production timelines. A carefully built dashboard empowers you to make data-driven decisions about everything from resource allocation to capital investment.
Target persona
This dashboard is for CFOs in manufacturing organizations looking to optimize inventory turns, reduce downtime, and maintain healthy margins despite rising material costs.
KPIs included
Manufacturing dashboards usually observe:
• Cost of Goods Sold (COGS)
• Inventory Turnover Rate
• Throughput and Production Efficiency
• Days Sales Outstanding (DSO)
• Operating Cash Flow
According to Oracle, CFO dashboard metrics should include revenue, profit, and a focus on operational efficiency (Oracle). By centralizing raw materials data, labor costs, and overhead metrics, you get a clearer picture of sub-assembly efficiencies and total production expenses.
Refresh cadence
A weekly or monthly refresh can suffice unless volumes are extremely high or historical data fluctuates greatly. Typically, stable production lines benefit from monthly aggregated metrics for cost-reduction insights.
What makes it effective
By visualizing real-time or near real-time production bottlenecks, you can address workflow issues faster. Your ability to correlate production metrics with financial statements means you can adjust pricing or renegotiate supplier contracts before they cut into profits.
Services CFO KPI dashboard
In a services-based environment, revenue generation often hinges on billable hours, resource utilization, and project-based financial oversight. A specialized CFO dashboard helps you control scope creep and assess overall profitability.
Target persona
This example caters to CFOs of consulting firms, agencies, and other professional services organizations focused on consistent billing and staff allocation.
KPIs included
Services dashboards frequently feature:
• Billable Utilization Rate
• Project Profitability
• Average Revenue per Billable Hour
• Operating Expense Ratio
• Accounts Receivable Turnover
The Operating Expense Ratio is especially relevant here, ideally between 60 and 80 percent, indicating a balanced use of resources (NOW CFO). When you track expense ratios side by side with specific projects, you can refine budgets and elevate cost controls in the face of changing client demands.
Refresh cadence
A biweekly or monthly dashboard refresh aligns well with invoicing cycles and project phase completions. This approach prevents any surprise deficits in cash flow or profit margin.
What makes it effective
In professional services, agile resource allocation is everything. By continuously monitoring staff workloads against project budgets, you retain the flexibility to shift personnel, correct misallocations, and negotiate contract revisions to protect your margins.
Healthcare CFO KPI dashboard
In healthcare, you have to watch more than your bottom line. Compliance regulations, patient outcomes, and payer structures introduce complexity. A healthcare CFO KPI dashboard blends financial and operational data to ensure that cost-effective care also meets rigorous standards.
Target persona
Healthcare CFOs at hospitals, outpatient clinics, or large physician groups who manage reimbursements, supply costs, and patient throughput benefit from this structure.
KPIs included
Core healthcare metrics can include:
• Patient Revenue per Encounter
• Cost per Patient Day
• Claim Denial Rate
• Accounts Receivable Aging by Payer
• Operating Cash Flow and Donation Inflows
Because healthcare finance involves multiple payers and unique billing cycles, CFO dashboards must display near-term liquidity measures, from current ratio to daily cash on hand (Oracle). You need immediate insight into how delays in insurance reimbursements affect overall cash flow.
Refresh cadence
Financial performance tracking usually happens weekly for practice-level data, while hospital systems may require daily updates on payer reimbursements and operational stats.
What makes it effective
Timely insight into claims processing issues is vital for controlling cost pressures. By spotting patterns in claim denials or prolonged pay cycles, you can adapt policies and optimize accounts receivable processes before they interrupt patient care budgets.
Financial services CFO KPI dashboard
In financial services, focusing on liquidity, interest coverage, and risk assessment is essential. You must routinely evaluate capital adequacy while optimizing returns in the face of evolving market conditions.
Target persona
This dashboard is for CFOs in banking, insurance, or investment management responsible for ensuring stable operations amid regulatory scrutiny and dynamic investment portfolios.
KPIs included
Financial services dashboards concentrate on:
• Net Interest Margin
• Liquidity Coverage Ratio
• Return on Equity (ROE)
• Total Debt to Equity Ratio
• Earnings per Share (for public entities)
Common CFO KPI dashboard examples mentioned in the 2025 guide usually highlight these fundamentals (insightsoftware). Understanding your ratio trends can help you predict funding needs, manage portfolio risks, and maintain compliance thresholds for capital reserves.
Refresh cadence
Certified real-time systems are available for heavily regulated institutions, but weekly or monthly intervals might suffice if you have moderate transaction volumes. The goal is to rapidly detect any capital shortfall or emergence of credit risk.
What makes it effective
A balanced view of asset health, core earnings, and regulatory benchmarks reduces your vulnerabilities to market turbulence. By aligning product lines, operational costs, and capital demands, you can make confident decisions about where to allocate resources or where to reduce exposure.
Multi-entity enterprise CFO KPI dashboard
For CFOs managing multiple subsidiaries or geographic divisions, consolidating data into one dashboard can be a game-changer. You need a holistic vantage point to validate each entity’s performance while upholding enterprise-wide profitability.
Target persona
This applies to CFOs at large enterprises spanning multiple legal entities, tax jurisdictions, and business models.
KPIs included
A multi-entity CFO dashboard might include:
• Revenue by Entity or Region
• Consolidated Operating Margin
• Intercompany Transactions and Elimination
• Cash Positions per Subsidiary
• Overall Return on Capital Employed
Insightsoftware notes that CFOs often must handle wide data sets with varied accounting standards (insightsoftware). Having a single platform to merge these metrics preserves accuracy and offers a clear line of sight into how each subsidiary influences your enterprise-level results.
Refresh cadence
Monthly or quarterly is common if you handle large volumes of data, especially when different entities follow separate reporting calendars. More frequent refreshes may be advisable when a subsidiary is under strategic review or coping with market fluctuations.
What makes it effective
With one enterprise-wide dashboard, you can quickly identify underperforming regional units, reallocate budgets, and unify strategic objectives. Consistent, consolidated visibility lifts your risk management processes above entity-level silos.
Conclusion
Whether you are a SaaS CFO monitoring churn or a manufacturing CFO needing to eliminate production delays, an effective KPI dashboard lets you shape proactive strategies instead of reacting to data that arrives too late. These CFO KPI dashboard examples reflect how different sectors prioritize distinct performance indicators, yet all share a common goal: clarity that drives timely financial and operational decisions.
For many CFOs, the next step is integrating these dashboards with advanced analytics tools, so you can spotlight underlying trends. We recommend assessing how your current reporting infrastructure supports each layer of visibility. If you are looking to upgrade your analytics ecosystem further, you can explore additional ideas at the cfo analytics stack in 2026 what a board actually expects. By proactively shaping your dashboard strategy, you will ensure that your finance team remains agile and prepared to guide your organization through shifting market landscapes.